Tracing
Distributed tracing, also called distributed request tracing, is a method used to profile and monitor applications, especially those built using a microservices architecture. Distributed tracing helps pinpoint where failures occur and what causes poor performance.
Mortar has you covered, but we haven’t reinvented a wheel.
Instead of defining a new Interface, you use a standard opentracing.Tracer Interface.
It’s defined here.
type Tracer interface {
    StartSpan(operationName string, opts ...StartSpanOption) Span
    Inject(sm SpanContext, format interface{}, carrier interface{}) error
    Extract(format interface{}, carrier interface{}) (SpanContext, error)
}
Usage
It’s best to StartSpan in a most outer layer of your Application.
Since you will probably build a gRPC web service, gRPC ServerInterceptor is that spot.
Mortar have everything predefined already.
Predefined Interceptors
Most likely you will not have to add anything, but use these predefined Interceptors.
Server
If you examine grpc.UnaryServerInterceptor
you can see that this Interceptor calls opentracing.StartSpanFromContextWithTracer which starts and returns a span with operationName using a span found within the context as a ChildOfRef.
If that doesn’t exist it creates a root span.
It also returns a context.Context object built around the returned span.
That’s great for gRPC communication, since everything will be found inside a Context.
But what if your REST API is called ?
Given that REST API is a reverse-proxy to your gRPC API, unless properly treated, the above code will create a new Server Span even if there is Tracing Information (usually found within HTTP Headers).
To fix that we need to inject any tracing information into our Context.
Unless you really have to, it’s best to handle everything on the gRPC layer.
If your REST API is implemented by gRPC-Gateway, you should use this Metadata Trace Carrier.
func HttpServerFxOptions() fx.Option {
 return fx.Options(
  providers.GRPCTracingUnaryServerInterceptorFxOption(),
  providers.GRPCGatewayMetadataTraceCarrierFxOption(), // read it's documentation to understand better
 )
}
Knowing what HTTP headers have this value depends on the Implementing Tracing library, Jaeger GO client knows how to do that :)
To better understand how MetadataTraceCarrierOption works read this
You can look at a working example here.
Clients
You should get yourself familiar with Mortar Clients first.
When calling remote services you need to pass your current Tracing information forward. Basically you have 2 options
- Create a Client Span for every remote call and then pass it.
- Just pass the Tracing Information forward.
Mortar supports the first (with Client Span) option out-of-the-box.
In order to use them, they must be provided to Uber-Fx first.
func HttpClientFxOptions() fx.Option {
 return fx.Options(
  providers.HTTPClientBuildersFxOption(), // client builders
  providers.TracerGRPCClientInterceptorFxOption(),
  providers.TracerRESTClientInterceptorFxOption(),
 )
}
Once provided you can use Mortar Clients as any other gRPC Clients.
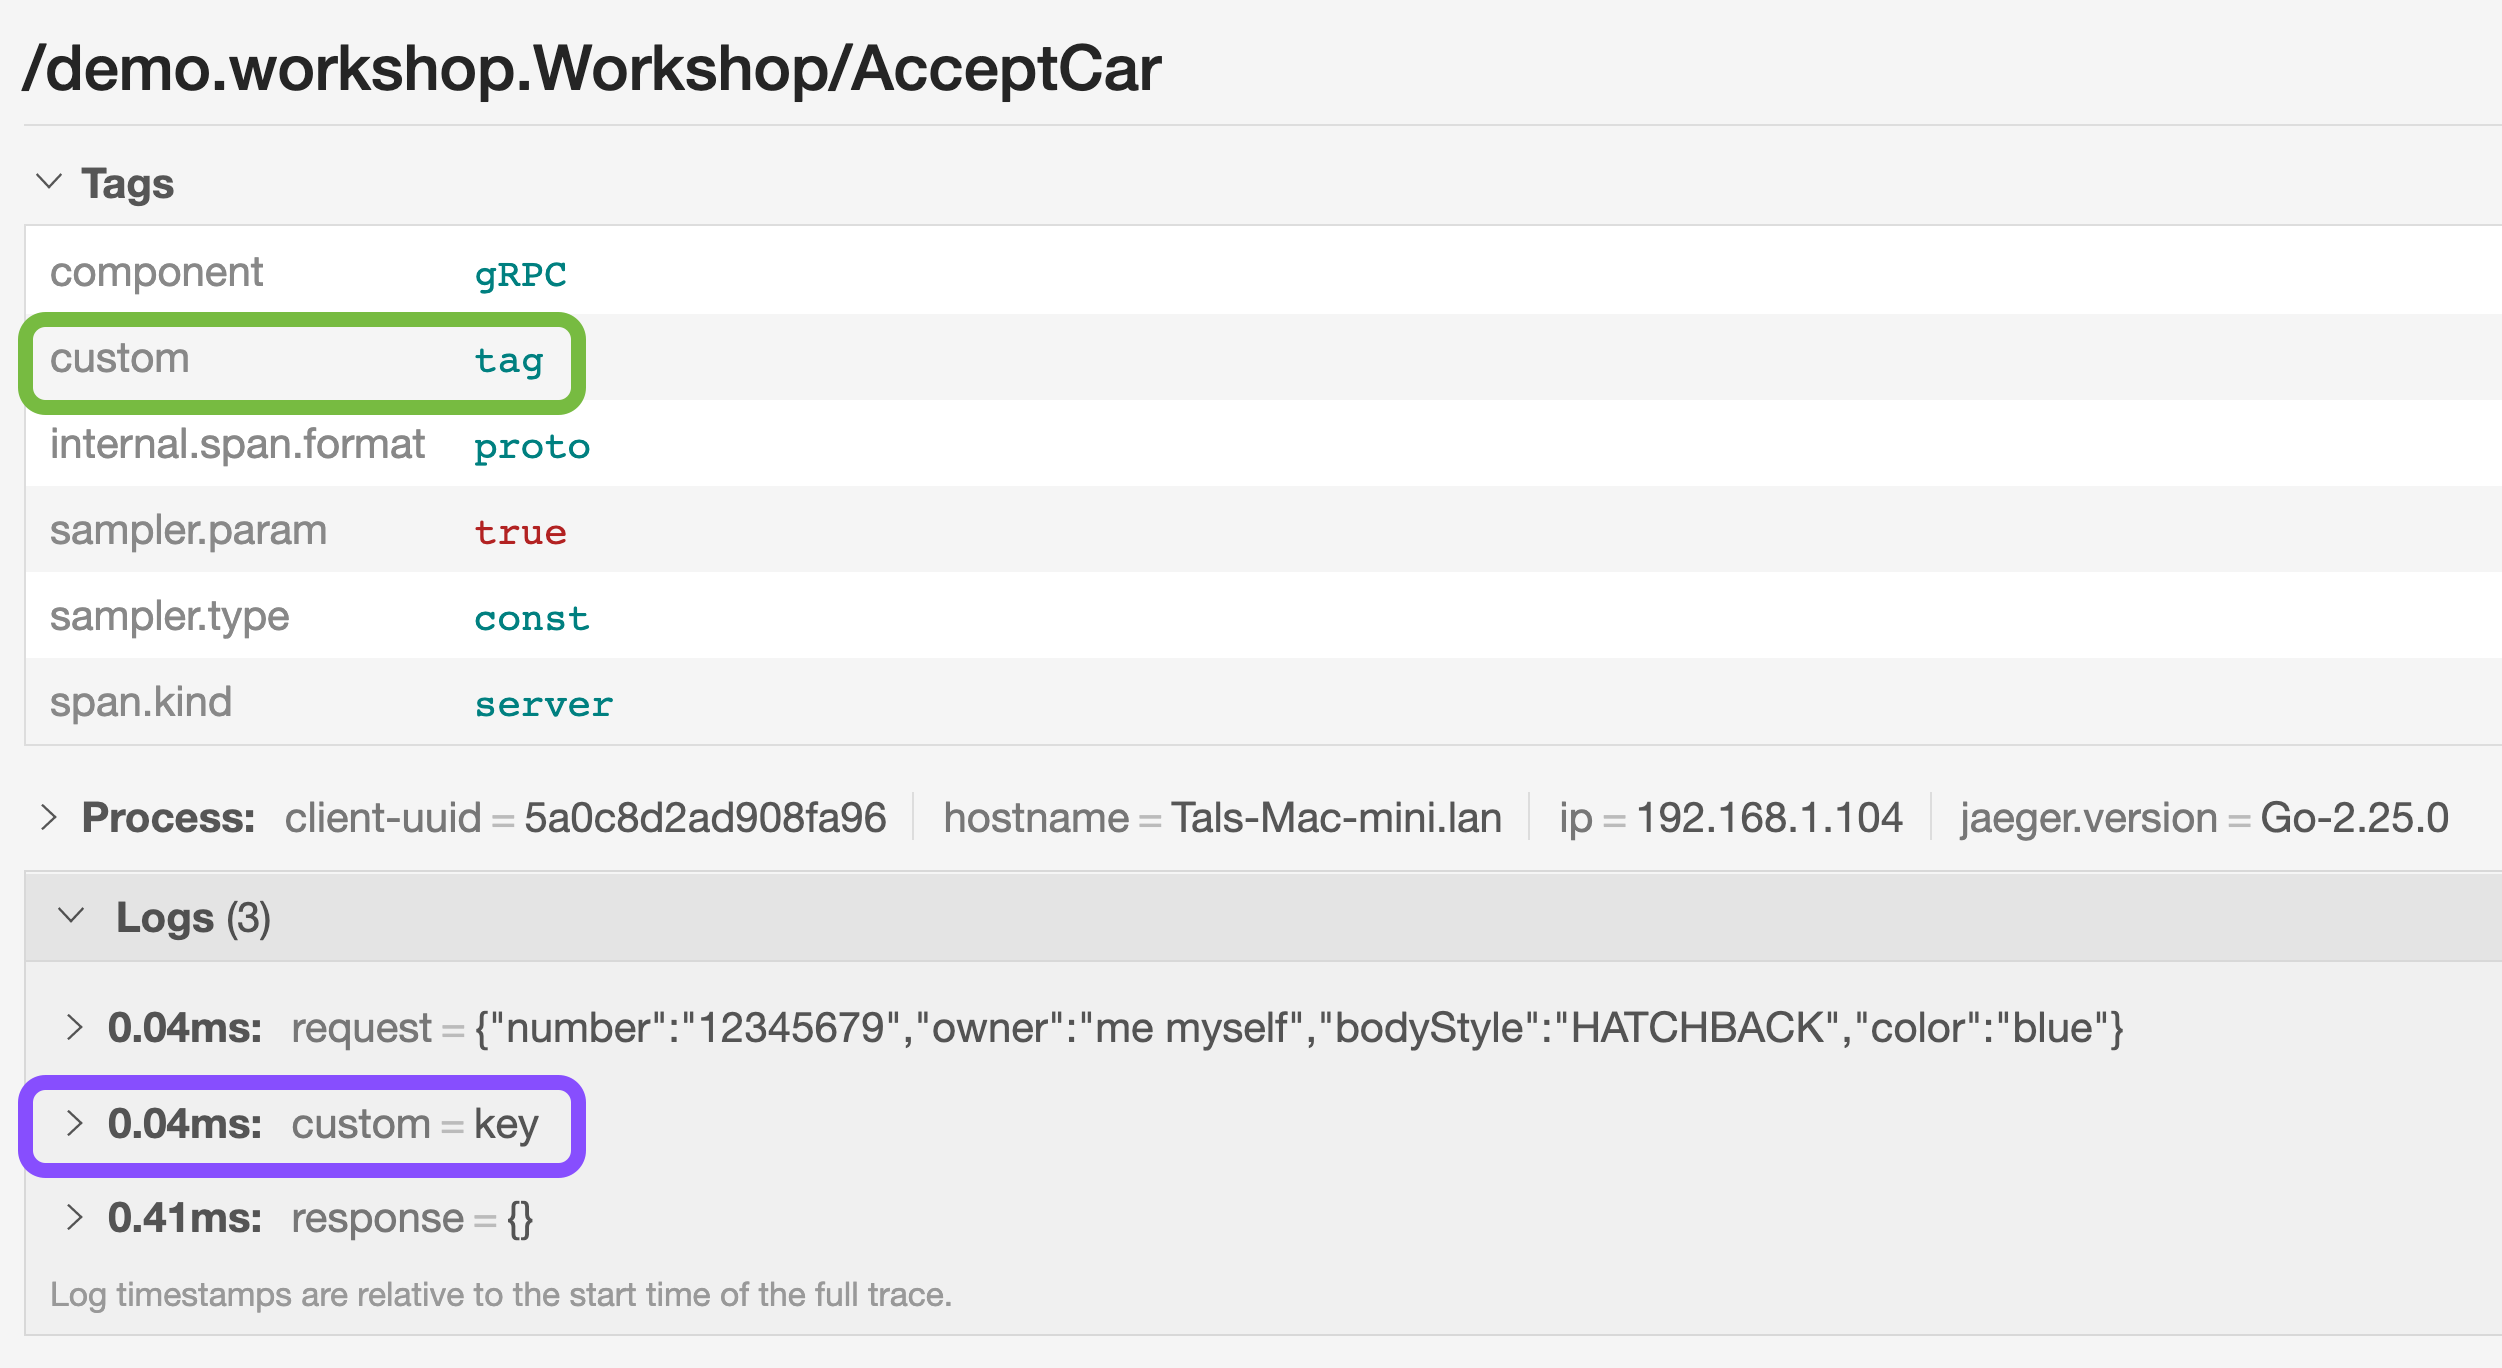
Adding dynamic info to current Span
Sometime you need to add a Custom Tag or a Custom Log to the current Span.
It’s really easy and it’s not related to Mortar.
-
To add a custom Tag:
if span := opentracing.SpanFromContext(ctx); span != nil { span.SetTag("custom", "tag") } -
To add a custom Log:
if span := opentracing.SpanFromContext(ctx); span != nil {
    span.LogFields(spanLog.String("custom", "key"))
}
Here is what it should look like in Jaeger.